
Why is my website slow?
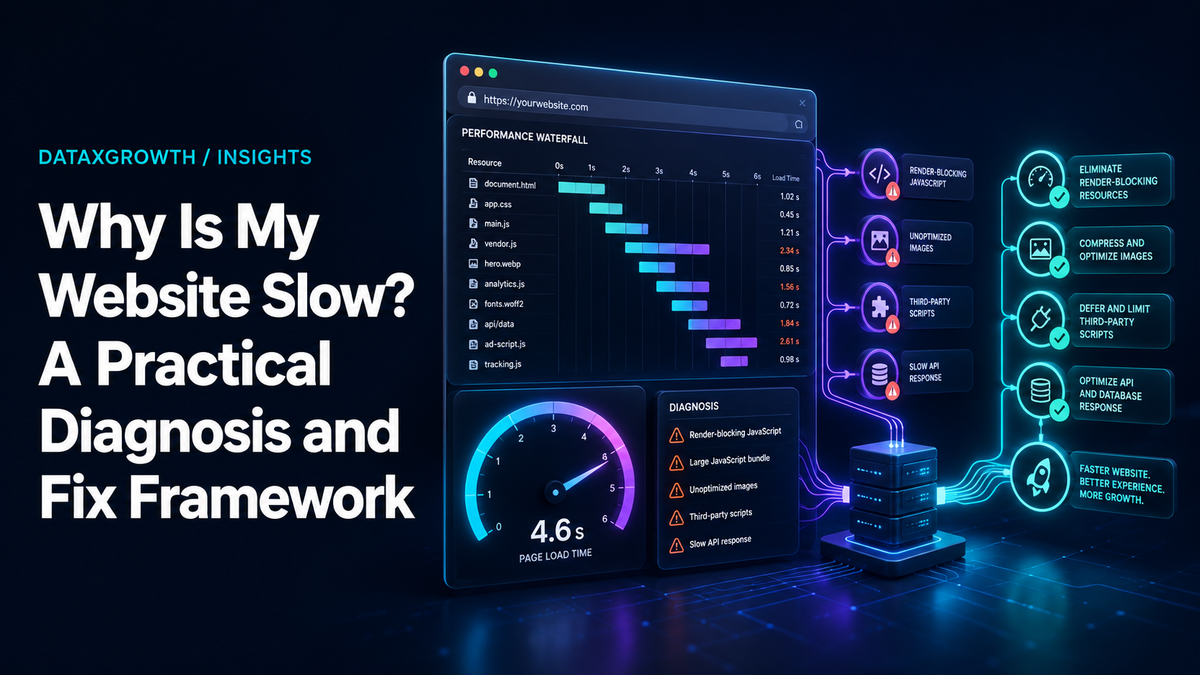
A website can be slow because of origin response time, network distance, render-blocking resources, heavy images or video, JavaScript and main-thread work, third-party tags, cache configuration, CMS or database issues, traffic capacity, or conditions that affect only certain devices and users. Diagnose the affected journey with field and laboratory evidence before changing code.
A speed score is a clue. A useful diagnosis identifies which users, pages, interactions, and system layers are slow—and proves the fix with the same measurement method.
Start with these cause categories
- Server, database, hosting, DNS, TLS, CDN, redirects, and regional distance
- HTML, CSS, JavaScript, rendering, hydration, and main-thread work
- Images, video, fonts, embeds, and page weight
- Analytics, advertising, consent, chat, testing, and other third-party scripts
- Browser, CDN, reverse-proxy, application, and object caching
- CMS plugins, themes, queries, scheduled jobs, and publishing changes
- Traffic spikes, capacity, provider incidents, deployments, and external services
- Device, browser, network, account state, geography, and returning-visitor differences
Measure before changing anything
Use the measurement layer that answers the question.
Field data
Field data records what real visitors experienced across actual devices, networks, locations, pages, and sessions. It is the best outcome layer for understanding whether meaningful segments are slow. Public Chrome User Experience Report data can provide an origin or URL view when the site has sufficient samples. First-party Real User Monitoring can provide deeper segmentation and page context.
Lab data
Laboratory tools run under controlled conditions. Lighthouse, PageSpeed Insights lab results, and browser performance traces can reproduce a page, inspect the request waterfall, find long tasks, and test a candidate fix. They are diagnostic tools; one simulated run does not describe every user.
Synthetic and availability monitoring
Synthetic tests repeat a defined page or journey from selected locations and devices. They are useful for trends, release regressions, and alerts. The controlled script may not reflect the full diversity of real visitors.
Google’s Core Web Vitals workflow says Core Web Vitals are best measured in the field and describes lab tools such as Lighthouse as diagnostics. It also notes that PageSpeed Insights can show both Chrome field data and Lighthouse lab data. Use web performance monitoring when you need continuous evidence instead of an isolated test.
Start with business-critical pages and symptoms
Do not begin with a sitewide average. Prioritize pages and interactions whose failure affects customers or revenue: entry pages, product or service pages, forms, checkout, account flows, search, pricing, and campaign landing pages.
Record:
- exact URL or template;
- device class, browser, network, geography, and account or consent state;
- new versus returning visit and cache condition;
- time window and measurement source;
- LCP, INP, CLS, TTFB, errors, requests, transferred bytes, and long tasks where relevant;
- form, transaction, or conversion behavior;
- recent deployments, content changes, campaigns, tags, traffic, and provider incidents.
Current Google guidance defines Largest Contentful Paint as loading performance, Interaction to Next Paint as responsiveness, and Cumulative Layout Shift as visual stability. For a “good” experience, Google currently recommends LCP within 2.5 seconds, INP under 200 milliseconds, and CLS below 0.1. Verify the thresholds at publication using Google’s Core Web Vitals documentation. These metrics do not replace accessibility, task success, or business outcomes.
Server response, hosting, and network
The browser cannot render a useful page until it receives required responses. A high or variable Time to First Byte can point toward origin, database, cache, network, or redirect work, but TTFB alone does not identify the cause.
Investigate:
- DNS lookup and connection behavior;
- TLS negotiation and redirect chains;
- CDN routing, edge coverage, cache misses, and origin shielding;
- application processing and uncached page generation;
- database queries, locks, external API calls, and queueing;
- serverless cold starts or container scaling;
- CPU, memory, disk, connection pools, and saturation;
- regional distance and third-party dependencies;
- traffic changes, bots, campaigns, and provider incidents.
Compare browser waterfall data with server, database, CDN, and application telemetry for the same time window. If latency rises only under load, a controlled website stress test may be appropriate after baseline diagnosis and authorization.
Render-blocking CSS, JavaScript, and main-thread work
A fast HTML response can still produce a slow experience if the browser must download, parse, compile, and execute too much work before it can render or respond.
CSS and the critical render path
Large or render-blocking stylesheets, unused rules, late-loaded fonts, and complex layouts can delay useful content or create instability. Identify the CSS required for the initial view, remove or defer work only when testing confirms it is safe, and preserve responsive and accessibility behavior.
JavaScript and interactivity
Large bundles, duplicate libraries, hydration, client-side rendering, long tasks, event handlers, and repeated layout work can delay interaction. Use a browser performance trace to find the interaction and main-thread activity that causes the delay. Avoid generic advice such as “remove JavaScript”; classify which code delivers customer value and which work can be reduced, split, deferred, moved, or eliminated.
Framework and application behavior
Rendering method, data fetching, route transitions, state, and component design affect performance. The correct fix depends on the codebase and measured bottleneck. A framework-specific rewrite without evidence can move the problem or add migration risk. DataXGrowth custom website development services can turn the diagnosis into scoped architectural or component work.
Images, video, fonts, and embeds
Media frequently affects loading and visual stability, but the correction must match the asset and page role.
- Serve images at appropriate dimensions and use responsive image candidates.
- Select a format and quality that preserve the required visual detail without unnecessary bytes.
- Prioritize the likely hero or LCP asset; avoid lazy-loading content required immediately.
- Lazy-load offscreen media and embeds when it does not break the customer journey.
- Reserve dimensions or aspect ratios to reduce layout movement.
- Subset and limit font files, review weights and styles, and test fallback behavior.
- Use posters, controlled loading, or user initiation for heavy video when appropriate.
- Audit third-party embeds for network, JavaScript, privacy, and layout cost.
An asset audit should list URL, type, bytes, dimensions, priority, cache headers, owner, affected metric, and candidate action. Do not compress every image blindly; protect legibility, brand quality, and accessibility.
Third-party scripts and marketing tags
Analytics, advertising, consent, chat, personalization, experimentation, reviews, scheduling, and embedded media can add network requests and main-thread work. They may also be essential to the business.
Build a cost-and-value inventory:
- provider, owner, purpose, and business decision supported;
- pages and users affected;
- load timing, network requests, transferred bytes, CPU time, and long tasks;
- consent and privacy conditions;
- duplicate or obsolete implementations;
- failure behavior and dependency;
- options to sequence, limit, self-host where appropriate, replace, or remove.
Do not delete measurement because it has technical cost. Coordinate with the analytics and attribution owner so a performance change does not make campaign or revenue reporting unreliable.
Caching and content delivery
Caching can reduce transfer and origin work, but the site may contain several independent layers: browser cache, CDN or shared cache, reverse proxy, application or object cache, and origin storage. A fast repeat view does not prove that a first visit or uncached response is fast.
Common issues include short or missing freshness for versioned assets, uncached HTML or API responses, low CDN hit ratio, personalized content stored in the wrong cache, stale deployments, service-worker behavior, and purge or invalidation mistakes.
Inspect response headers and test cold, warm, authenticated, and relevant regional conditions. The dedicated guide explains how browser caching works, including freshness, validation, Cache-Control, and stale-content diagnosis.
CMS, plugins, themes, and database
CMS performance problems often appear as a combination of code, data, hosting, and operating practices rather than one “bad plugin.”
For WordPress or similar systems, review:
- unsupported, outdated, duplicate, or conflicting extensions;
- theme and page-builder rendering cost;
- database queries, indexes, autoloaded settings, transients, and table growth;
- scheduled jobs, background processing, search, and external API calls;
- object and page caching behavior;
- media processing, revisions, logs, and backups;
- administrator and editor workflows that create oversized or complex pages;
- hosting resources, PHP or runtime configuration, and platform limits.
Create a backup and controlled test plan before disabling extensions, changing database behavior, or modifying production configuration. The website maintenance service defines ongoing ownership for updates, backups, regression checks, and routine support.
Why a website becomes suddenly slow
A sudden regression usually has a time-bound change. Build a timeline before assigning causality.
Check:
- code, theme, plugin, package, infrastructure, and configuration deployments;
- new images, video, fonts, embeds, banners, personalization, or page-builder sections;
- analytics, advertising, consent, chat, and experimentation tags;
- campaign launch, media coverage, seasonality, bot activity, or unusual traffic;
- database growth, background jobs, queues, or external API failures;
- CDN, DNS, hosting, certificate, regional, or vendor incidents;
- cache purge, expiration, warming, or service-worker changes;
- browser releases or client-specific behavior.
Compare matched time windows, device and geography segments, cache conditions, and the release record. Revert or disable one controlled factor when safe and test with the same method. If recurring changes are difficult to correlate, use continuous monitoring and deployment annotations.
Prioritize, fix, and verify
Rank candidate fixes using evidence instead of the largest theoretical score improvement.
A practical backlog score
- Affected audience: how many relevant users and segments experience the defect?
- Page value: does the issue affect a critical journey or high-value template?
- Evidence: do field, lab, server, or change records support the diagnosis?
- Expected metric effect: which measured symptom should change?
- Business relevance: could the change improve task completion or reduce operational risk?
- Effort and dependency: which teams, vendors, releases, or migrations are required?
- Risk: can the change affect accessibility, tracking, content, security, or stability?
- Verification: can the team retest under matched conditions and monitor regressions?
Implement one controlled change when practical. Retest the same URL, journey, device, environment, and measurement layer. Preserve guardrails such as conversion events, error rates, accessibility, and content accuracy. A fix is complete when the targeted symptom improves without creating a more important defect.
A slow-site diagnostic sequence
- Confirm the report and affected customer journey.
- Check availability, errors, and current incidents.
- Separate field outcome data from lab diagnosis.
- Compare priority pages, templates, devices, locations, and cache states.
- Inspect the request path from DNS and CDN through origin and database.
- Inspect rendering, JavaScript, media, fonts, and third parties.
- Review CMS, content, deployment, traffic, and provider changes.
- Form a testable hypothesis with an owner and expected metric movement.
- Change one controlled factor, validate, and monitor.
- Record the result and add a regression check when the risk justifies it.
Common website-speed diagnostic mistakes
Avoid conclusions that the evidence cannot support.
- Optimizing only the homepage: high-value landing pages, forms, product templates, or authenticated journeys may use different code and data.
- Treating one Lighthouse run as a customer baseline: laboratory conditions are repeatable but do not represent the full distribution of real devices and networks.
- Chasing the aggregate score: use the underlying network, rendering, interaction, and audit evidence that corresponds to the observed symptom.
- Changing several systems at once: simultaneous hosting, caching, image, plugin, and tag changes make attribution weak and rollback harder.
- Ignoring cache state and user state: new visitors, returning visitors, authenticated users, consent states, regions, and experiments may receive materially different experiences.
- Removing business-critical tools without an owner: a technically faster page can be operationally worse if measurement, consent, support, or conversion flows stop working.
- Declaring success before field evidence matures: a lab improvement is an important release signal, but real-user data may require an observation window and enough representative traffic.
A defensible diagnosis states what is known, what is inferred, what will be changed, which metric should move, and what evidence would disprove the hypothesis.
Website speed FAQs
Is PageSpeed Insights enough?
No. It is useful for an initial view and combines available Chrome field data with Lighthouse lab diagnostics. It may show origin-level rather than URL-level field data, and sites with insufficient samples may have no CrUX field data. Use additional field, lab, synthetic, and server evidence as needed.
Why is my website slow only on mobile?
Mobile visitors may have slower processors, less memory, unstable networks, different viewport behavior, touch interactions, consent states, or mobile-specific content. Segment field data and reproduce the issue with representative devices and conditions.
Can plugins make a website slow?
Yes, but the mechanism matters. An extension may add database work, scripts, styles, external calls, scheduled jobs, or incompatible behavior. Measure the affected request or interaction and test changes safely before removal.
Will faster Core Web Vitals improve rankings or conversions?
Better user experience is valuable, and Google uses Core Web Vitals within broader page-experience systems. A threshold or speed score does not guarantee a ranking or conversion increase. Define the affected journey, baseline, outcome, and other influences.
When should I use stress testing?
Use an authorized stress test when the question is how the system degrades and recovers beyond expected load. If the site is already slow under normal traffic, complete baseline diagnosis first.
Diagnose the bottleneck before buying a fix
Request a website performance diagnostic from DataXGrowth. We will separate field outcomes from lab findings, map the affected system layer, prioritize fixes by evidence and business impact, and define how each change will be validated.