
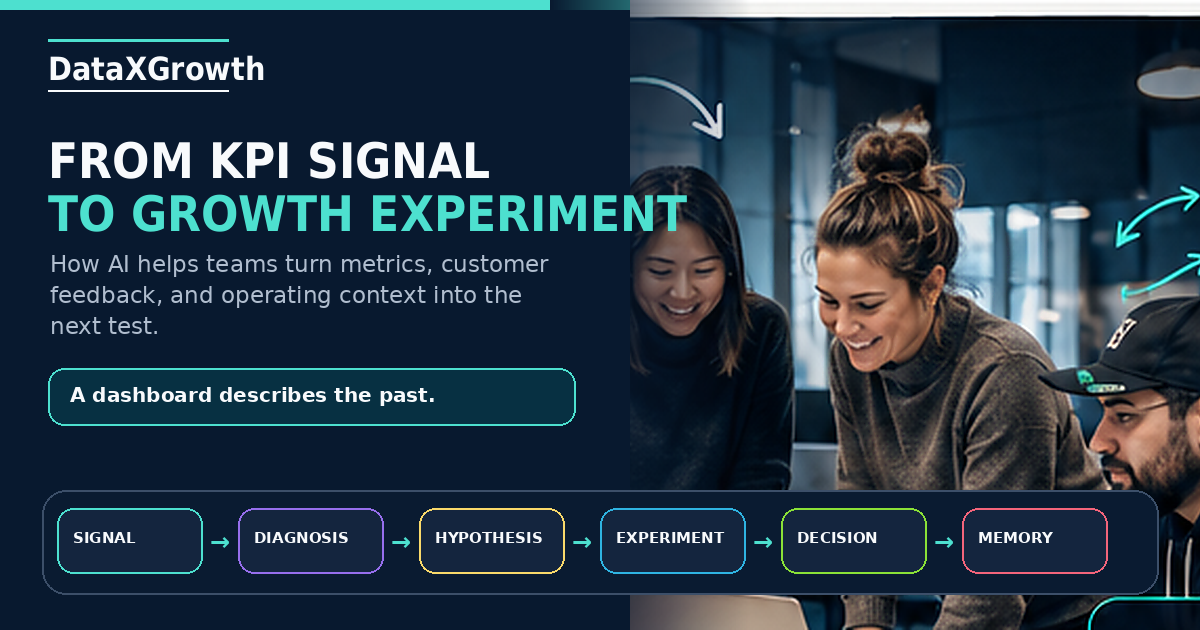
Most growth dashboards are built to describe the past.
Traffic increased. Customer acquisition cost rose. Conversion declined. Email revenue improved. One audience performed better. Return rates moved in the wrong direction.
The team reviews the numbers, discusses possible explanations, and leaves the meeting with a loose list of next steps. That is reporting. A growth system should turn the same evidence into a decision.
The real questions are: What changed? Is the change meaningful? What might explain it? What evidence supports each explanation? What is the smallest experiment that can reduce the uncertainty? What result will make us kill, iterate, scale, or investigate?
AI can make that process faster, but it does not make an assumption true. Treat every AI answer as a hypothesis until customer evidence or channel data validates it.
This article uses Aster Lane, a fictional premium direct-to-consumer sneaker company, as a worked example. All company names and metrics are illustrative.
A dashboard is not an experiment system
A dashboard answers, “What happened?” An experiment system answers, “What should we do because it happened?” That distinction separates teams that report performance from teams that compound learning.
Reporting says, “We generated 1,200 leads.” Interpretation says, “Lead volume increased, but the qualified rate declined.” Diagnosis says, “The new offer may be attracting a broader, lower-intent audience.” Experimentation says, “We will test a more specific offer and judge the result by cost per qualified lead rather than total lead volume.”
Every KPI needs a job. A useful KPI should help the team allocate budget, change an offer, fix a conversion path, sharpen an ICP, improve customer quality, or choose the next experiment.
The growth decision loop
A practical decision loop has six stages: Signal → Diagnosis → Hypothesis → Experiment → Decision → Growth Memory.
1. Signal: what changed?
A signal is a meaningful change in business or customer behavior, not every fluctuation in a dashboard. Examples include CAC increasing by 18%, landing-page conversion falling from 3.1% to 2.4%, one ICP segment generating twice the close rate, returns increasing after a campaign launch, or trial signups growing while activation remains flat.
Before reacting, ask whether the change is sustained, isolated to a channel or segment, large enough to affect the business, and unlikely to be caused by seasonality, tracking errors, attribution changes, or small-sample noise.
2. Diagnosis: where is the constraint?
Diagnosis identifies the part of the growth system most likely responsible for the signal. Common categories are measurement, traffic quality, ICP fit, positioning, offer, pricing, creative, landing-page friction, product experience, sales follow-up, retention, and operational capacity.
Strong click-through rate with weak conversion, for example, can indicate a message-to-page mismatch, poor traffic quality, an unconvincing offer, or buying friction. The metric alone does not tell you which explanation is correct.
3. Hypothesis: why might it be happening?
A hypothesis is a specific, falsifiable explanation linked to observed evidence.
We believe [specific audience] is experiencing [specific friction], causing [observable behavior]. If we change [one meaningful variable], we expect [primary KPI] to improve without harming [guardrail KPI].
A weak hypothesis says, “The landing page is bad.” A stronger one says, “First-time mobile visitors are abandoning the product page because sizing information is difficult to find before the add-to-cart action.”
4. Experiment: what change will test it?
A clean experiment defines the audience, the variable being changed, what remains constant, the primary KPI, the guardrail metrics, the minimum run condition, and the decision criteria before launch. The objective is not to prove the team right. It is to reduce uncertainty quickly enough to improve the next decision.
5. Decision: kill, iterate, scale, or investigate?
Kill when the primary KPI does not improve, customer quality worsens, or evidence contradicts the hypothesis. Iterate when the result is directionally positive but inconclusive. Scale when the result is meaningful, economics and customer quality remain healthy, and the effect appears repeatable. Investigate when tracking is unreliable, the sample is too small, results conflict, or a confounding variable changed.
6. Growth memory: what should the team remember?
Every completed experiment should record the signal, evidence, hypothesis, audience, change, primary and guardrail KPIs, result, decision, learning, and next test. Growth memory prevents repeated failures, lost context, and scaling a tactic without understanding why it worked.
The evidence stack AI should analyze
The strongest experiment ideas combine three types of evidence. Quantitative evidence includes revenue, CAC, MER or ROAS, funnel conversion, cohort behavior, return rate, retention, activation, product usage, and pipeline. Qualitative evidence includes reviews, returns, sales notes, support tickets, surveys, comments, email replies, interviews, and lost-deal reasons. Operational evidence includes follow-up speed, inventory, creative capacity, tracking gaps, shipping delays, budget, and workload.
AI is useful because it can synthesize these sources faster than a team can read them manually. The output should still separate observed fact, interpretation, unverified assumption, recommended test, and missing information.
Worked example: a premium sneaker brand
Aster Lane sells $220 minimalist sneakers for work, travel, and everyday wear. Its primary customer hypothesis is an urban professional who wants one polished, comfortable sneaker that can move between the office, airport, dinner, and weekend use.
At Week 6, site conversion is 1.31% against a 1.45% target. Paid CAC is $101 against a target of $98 or lower. AOV is $241 against a $245 target. Overall return rate is 13.8% against a target of 12.5% or lower. Email and SMS revenue share is 25.4% against a 28% target.
The most important signal is channel-specific: fit-related return rate is 16.7% for Meta customers and 9.6% for Google customers.
The easy conclusion is, “Meta produces low-quality customers, so reduce Meta spend.” That may prove correct, but it is premature.
The team uses AI to synthesize Meta ad comments, product reviews, written return reasons, product-page analytics, fit-guide usage, Google search terms, and support tickets. It finds that Meta customers frequently ask whether the shoe runs narrow; reviews describe the fit as structured or slightly narrow; fit-guide users convert at a higher rate; Google customers often search for fit information before arriving; and Meta creative emphasizes style without explaining fit.
The better diagnosis is that Meta reaches buyers earlier in the decision process, and some purchase before receiving enough fit education.
Hypothesis: Better pre-purchase fit education for Meta-acquired visitors will reduce fit-related returns while maintaining or improving product-page conversion.
Four experiments from one signal
Product-page fit module
Add a visible fit recommendation, a “runs slightly narrow” note, customer fit examples, size comparison guidance, an exchange promise, and a direct fit-guide link. Primary KPI: product-page conversion. Guardrail: fit-related return rate. Scale if conversion improves and returns remain stable or decline.
Meta fit-education retargeting
Retarget product viewers with a fit demonstration, customer sizing examples, the exchange process, and a simple sizing guide. Primary KPI: retargeting purchase rate. Guardrail: return-adjusted CAC. Scale if return-adjusted CAC improves versus standard product retargeting.
Creative qualification
Replace broad style messaging with clearer fit positioning: “Premium everyday sneakers for buyers who prefer a structured, close fit.” Primary KPI: return-adjusted CAC. Guardrail: new-customer order volume. Scale if volume remains commercially viable and fit-related returns improve materially.
Browse-abandonment fit email
Send product viewers recommended sizing guidance, customer fit notes, exchange information, and on-foot images. Primary KPI: click-to-purchase rate. Guardrails: unsubscribe rate and return rate. Iterate if engagement rises without purchase; scale if conversion and customer quality both improve.
Prioritize experiments with evidence, not idea volume
Score each experiment from 1 to 5 across business impact, evidence strength, learning speed, execution effort, and reversibility.
Priority score = Business impact × Evidence strength × Learning speed ÷ Execution effort
Use reversibility as a tie-breaker. In the sneaker example, the product-page fit module should rank above a full sizing quiz because it has stronger evidence, faster learning speed, high potential impact, and much lower effort.
AI can apply the same scoring model across a large backlog. The team should still review the assumptions behind every score.
Use a standard growth experiment card
Every experiment card should include: experiment name; KPI signal; quantitative, qualitative, and operational evidence; hypothesis; audience; variable being changed; primary KPI; guardrail KPIs; minimum run condition; kill, iterate, scale, and investigate rules; intended learning; and the next test for each likely outcome.
For the fit-module experiment, the strategic learning is not merely whether a page component wins. It is whether fit education can improve both acquisition performance and post-purchase customer quality.
How AI augments each stage
Signal detection: compare periods, flag anomalies, identify segment-level differences, and surface changes tied to the KPI tree. Feedback synthesis: cluster reviews, comments, sales notes, returns, and interviews into pains, objections, and expectation gaps. Hypothesis generation: produce several plausible explanations, list evidence for and against each one, identify missing information, and rank confidence.
Experiment design: convert a hypothesis into an audience, variable, KPI, guardrails, run condition, and decision rules. Backlog prioritization: apply one scoring model across competing tests. Weekly review: summarize what launched, changed, failed, or remains inconclusive. Growth memory: maintain an assumption log and experiment history across channels, agencies, hires, and planning cycles.
The value is not that AI replaces the growth team. The value is that it reduces the manual work required to connect evidence to the next decision.
The weekly AI-assisted experiment review
The weekly meeting should answer: Are we still optimizing against the correct 90-day objective? What materially changed in the KPI tree? Which experiments reached a decision threshold? What customer feedback changed our understanding? What should stop? What deserves another version? What has enough quality signal to scale? What is the highest-value next experiment? What should be added to growth memory?
The review should end with one decision per completed experiment, one owner per next action, one prioritized next test, and a date for the next decision.
Reusable AI prompt
Act as a senior growth strategist helping us convert KPI signals into a prioritized experiment backlog.
Business objective: [insert]
KPI tree: [insert]
Current performance: [insert]
Changes from the previous period: [insert]
Channel-level and segment-level results: [insert]
Customer feedback: [insert]
Sales, support, return, or product observations: [insert]
Experiment history: [insert]
Budget and execution constraints: [insert]
For each material signal: state the observed fact; separate fact from interpretation; identify 3–5 plausible causes; list supporting and contradicting evidence; state missing information; recommend a testable hypothesis; design one focused experiment; define the audience, variable, primary KPI, guardrails, and minimum run condition; define kill, iterate, scale, and investigate rules; score business impact, evidence strength, learning speed, execution effort, and reversibility; rank the backlog; and state what should be added to growth memory.
Do not present assumptions as facts. Prioritize business impact and learning quality over activity volume.
Common experimentation mistakes
Avoid changing too many variables at once, choosing a vanity metric, ignoring guardrails, ending tests too early or too late, treating correlation as causation, failing to store the learning, and scaling before replication. A test can improve click-through rate while damaging margin, returns, retention, lead quality, or support volume.
What the team should know after 90 days
A disciplined experiment system should reveal which ICP responds fastest and retains best; which offers create qualified action; which messages and proof increase conversion; which channels create durable customers; which funnel stages constrain growth; which product frictions damage acquisition; which KPIs predict downstream quality; and which assumptions remain unresolved.
The real output is a better model of how the market behaves, not a larger archive of campaign results.
The dashboard is the beginning, not the end
A dashboard describes the past. An experiment system improves the next decision.
AI can make the loop faster by connecting metrics, customer feedback, experiment history, and operational context. It cannot replace a clear business objective, measurement discipline, customer evidence, controlled testing, or human judgment.
The strongest growth teams will not be the teams generating the most experiment ideas. They will be the teams that recognize meaningful signals, form better hypotheses, run cleaner tests, decide faster, and retain what they learn.
Start with one meaningful KPI signal. Combine it with customer evidence. Then design the smallest experiment that can reduce the uncertainty.