
Most marketing teams discover a problem when the aggregate dashboard finally turns red.
Organic traffic is down. Conversion is weakening. CAC is rising. Pipeline is behind target.
By that point, however, the underlying issue may have been developing for weeks. The dashboard is not necessarily wrong. It is simply late.
The traffic decline was not the first signal. It was the last one.
Aggregate KPIs compress many smaller events into one result. Individual pages can begin losing impressions, rankings, and click-through rate before total organic sessions show a large decline. One device, audience, product, or acquisition source can deteriorate while the blended conversion rate still appears stable.
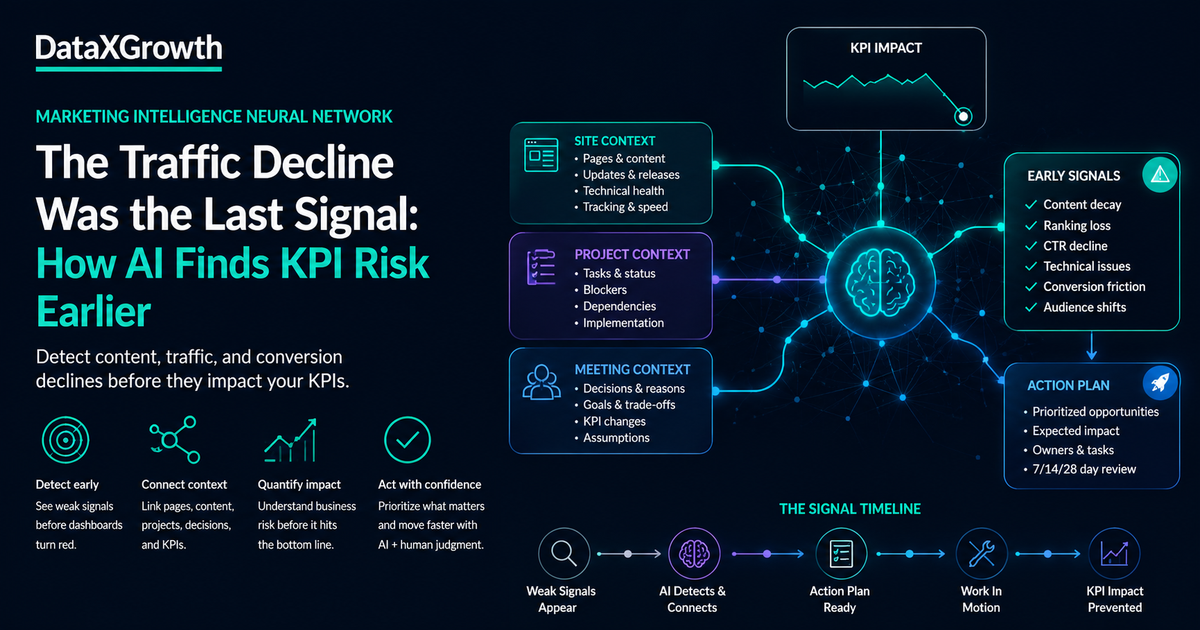
A marketing intelligence system creates leverage by detecting those upstream changes, connecting them to the company’s KPI tree, and moving the response forward before the lagging metric becomes an urgent business problem.
Clients rarely miss KPIs all at once
A missed KPI is normally the end of a chain, not a single isolated event.
For organic acquisition, clicks are the product of search visibility and the percentage of that visibility converted into clicks. Impressions can weaken because rankings decline, pages leave the index, search demand changes, content becomes outdated, multiple URLs compete for the same intent, or technical crawl problems accumulate. Click-through rate can deteriorate even while impressions rise because the result no longer matches the query or earns attention on the search page.
For conversion, the relevant equation is qualified sessions multiplied by conversion rate. A company can maintain traffic and still lose conversions because the traffic mix changed, a form added friction, the offer weakened, mobile performance declined, inventory changed, a page release introduced a problem, or tracking stopped recording the action correctly.
For qualified pipeline, conversion is only the first step. Lead quality, sales acceptance, routing, follow-up speed, opportunity progression, and deal value determine whether the acquisition activity reaches the business KPI.
When the final number misses target, the useful question is not only, “What happened to the KPI?” It is, “Which upstream node started deviating first?”
What we mean by a marketing intelligence neural network
DataXGrowth AI is being developed as a neural-network-style marketing intelligence layer. That does not mean one opaque model predicts every marketing result. It means the system connects many specialized inputs and analysis skills so that one observation can influence a more complete diagnosis.
The input nodes include search performance, page-level content data, technical SEO, analytics, conversion paths, CRM outcomes, project status, site releases, meeting decisions, customer feedback, and previous experiments.
Specialized AI skills examine different parts of that network. One skill may detect content decay. Another may classify a query loss as a position, demand, CTR, or intent problem. Another may map a page into its topic cluster. Another may look for technical anomalies. Another may check whether the recommended remediation has already been briefed, approved, assigned, published, or blocked.
The relationship layer connects query to page, page to topic cluster, cluster to ICP and journey stage, and the affected journey to a business KPI. It also connects meeting decisions to project tasks, project tasks to site releases, and releases to later performance movement.
The output is not a generic alert that says traffic is down. It is an evidence-weighted interpretation of what moved, where it moved, when it began, why it may matter, what is already being done, what remains uncovered, and which human decision is required next.
Case study: the response was already moving before the dashboard alarm
A recent example came from a B2B software company in a regulated category with a large organic content footprint. The company’s marketing lead noticed that aggregate organic traffic was declining and asked for an explanation.
That was not the beginning of the investigation.
Before the broad decline became the visible concern, our marketing intelligence workflow had already detected page-level losses across high-authority and commercial content. It had quantified the lost clicks and impressions, reviewed the pages for content and technical causes, generated optimization recommendations, and sent the work through human review.
When the aggregate traffic question arrived, eight page updates were already approved, assigned, and ready for implementation. Those pages represented 336 lost clicks and nearly 79,000 lost impressions—approximately 15% of the sitewide click decline and 20% of the impression decline.
Five of seven previously prioritized authority pages were ready to publish and accounted for 61% of the click loss inside that priority group. The team was not starting with an empty backlog. It already had a ranked publishing queue tied to measurable search impact.
Several technical actions were already complete as well. A priority article had been updated and published. Crawl-noise rules had removed roughly 2,400 tracking URLs from consideration. A sitemap cleanup had removed more than 28,000 unnecessary image entries. Other work—such as archive consolidation, a major standards rewrite, topic-cluster separation, and video visibility—was already identified and moving through the project system.
There were still important uncovered gaps. One individual guide represented 157 lost clicks and still needed an implementation task. Some commercial archive URLs remained unresolved. A major rewrite was not yet implementation-ready. A cluster-level intent decision and a full video watch-page system remained open.
By the time the aggregate decline became the visible alarm, roughly 90% of the known response work was already diagnosed, briefed, approved, assigned, completed, or placed into the implementation queue.
That does not mean 90% of the lost traffic had already been recovered, or that 90% of the decline had been fully explained. It means the operational uncertainty around the response plan had been reduced. Most known remediation items had a status, owner, next action, or measurement window.
This distinction matters. The value of the intelligence layer was not that it magically predicted the future. It shortened the distance between an early weak signal and executable work.
What the AI workflow did before the aggregate decline was raised
Detected page-level deterioration before the sitewide KPI became the main concern.
Separated position loss, impression loss, CTR deterioration, outdated content, cluster overlap, and technical issues instead of treating every loss as the same problem.
Quantified the impact by page so that commercially and strategically important content moved ahead of lower-impact work.
Generated optimization briefs and routed them into human review rather than changing pages autonomously.
Connected approved recommendations to assigned project tasks, owners, due dates, and implementation status.
Maintained a list of remaining gaps so the later dashboard alarm did not create duplicate analysis or restart the process.
Why aggregate dashboards detect problems late
Aggregate reporting is designed to summarize. That strength is also its weakness.
A large website may contain several pages that are growing, many that are stable, and a small group of commercially important pages that are deteriorating. The total can look acceptable while the pages that carry authority, demand, or conversion value weaken underneath it.
A blended conversion rate can also hide local deterioration. Mobile conversion may be falling while desktop is stable. A priority ICP may be weakening while lower-value traffic rises. Returning customers may mask weaker new-user behavior. One high-volume channel can hide an emerging problem in another.
Weekly and monthly reporting periods add more delay. By the time the aggregate movement becomes large enough to trigger attention, the upstream issue may already have affected several planning cycles.
The purpose of the intelligence network is not to escalate every small variation. It is to monitor smaller leading indicators and identify combinations that create credible exposure to a business KPI.
Trace the KPI backward until the first credible break
The diagnosis should follow the dependency chain.
If impressions decline
Investigate search demand, rankings, indexation, content relevance, technical crawl conditions, and cannibalization.
If impressions remain stable but clicks decline
Investigate CTR, result presentation, intent alignment, competing results, AI answers, and other search-page features.
If search clicks are stable but analytics sessions decline
Investigate tracking, consent, analytics tags, redirects, attribution, bot filtering, and reporting definitions.
If traffic is stable but conversion declines
Investigate page releases, offer, form friction, product availability, traffic quality, mobile experience, technical errors, and pricing.
If conversion remains stable but qualified pipeline declines
Investigate lead quality, ICP fit, qualification definitions, routing, sales acceptance, follow-up, CRM reporting, and opportunity progression.
This backward trace prevents the team from solving the wrong problem. More traffic does not fix broken conversion. Better conversion does not fix poor qualification. A content refresh does not fix missing tracking. An ad test does not fix a blocked implementation.
The specialized skills inside the network
Content decay detector: finds pages losing visibility, rankings, clicks, or CTR relative to their own baseline.
Query-loss classifier: separates demand, position, CTR, intent, SERP, and cannibalization problems.
Topic-cluster mapper: connects an affected page to supporting content, commercial pages, related standards or categories, internal links, and competing URLs.
Technical anomaly detector: looks for indexation, crawl, sitemap, AMP, redirect, canonical, tracking, and rendering problems.
Conversion-path analyst: determines whether the constraint is visibility, traffic quality, page behavior, form completion, or downstream qualification.
Project-memory mapper: identifies whether the issue is new, already diagnosed, awaiting review, approved, assigned, in implementation, complete, or blocked.
Optimization-brief generator: converts the evidence into a scoped recommendation with expected outcome, KPI, guardrail, owner, and review window.
The confidence model
AI should not present the first plausible cause as fact. Each explanation should be evaluated against six questions.
Evidence strength: how many independent sources support the explanation?
Business proximity: how directly is the signal connected to the threatened KPI?
Temporal alignment: did the upstream signal begin moving before the lagging KPI?
Coverage: is the issue isolated, segment-specific, or widespread?
Existing work: has the problem already been diagnosed, addressed, or queued?
Contradicting evidence: what makes the explanation less certain?
The result should classify each explanation as a high-confidence driver, plausible contributing factor, unresolved question, or unrelated noise.
Human judgment still controls the system
The intelligence layer can detect, compare, cluster, quantify, retrieve, draft, prioritize, and track. It should not independently determine whether a content change is accurate, whether an audience matters, whether a correlation is credible, whether a recommendation fits the brand, or whether the expected commercial impact justifies the work.
Strategists and subject-matter experts review the evidence, correct the interpretation, approve the work, and decide what reaches the customer environment.
Every AI interpretation remains a hypothesis until customer evidence, channel data, or a controlled test validates it.
The operating cadence
The network should support different review speeds.
Automated or daily monitoring covers severe page, query, technical, conversion, and tracking anomalies.
The weekly intelligence review asks what deteriorated, what recovered, what newly threatens a KPI, what work is already moving, what needs approval, and what should be deprioritized.
The 7-day review verifies deployment and tracking.
The 14-day review evaluates leading indicators.
The 28-day review determines whether the improvement is durable and affecting the intended KPI.
This is how the weekly growth meeting becomes an operating system: what launched, what was learned, what should stop, what deserves another iteration, what has quality signal, and what is the highest-leverage next test.
Measure the intelligence system itself
A useful system should prove that it improves marketing operations, not merely produce more alerts.
Mean time to detection: how quickly did the network identify the issue?
Mean time to diagnosis: how long from alert to an evidence-backed hypothesis?
Mean time to brief: how quickly did the issue become executable work?
Response-plan coverage: how much of the known remediation backlog has a status, owner, and next action?
Pre-alarm readiness: how much of the response work was underway before the aggregate KPI alert?
Recommendation acceptance rate and false-positive rate: how often did human reviewers approve the recommendation, and how often did the system escalate normal noise?
Recovery rate and learning retention: did the updated pages or journeys improve, and can the system retrieve what was tried and learned?
Reusable AI prompt
Act as a marketing intelligence analyst. The business is at risk of missing this KPI: [insert KPI, target, and current result]. Analyze the upstream marketing network using page and query performance, channel traffic, conversion by page/device/channel/ICP, technical and tracking status, recent site releases, content freshness, project tasks and blockers, meeting decisions, customer and sales feedback, previous optimization briefs, and published or in-progress work. Return: the earliest signals that began weakening; the date each signal moved; affected pages, segments, or journeys; likely downstream KPI exposure; high-confidence drivers; plausible contributing factors; contradicting evidence; existing work already addressing the issue; remaining uncovered gaps; a prioritized remediation plan; owner and status for each action; 7-, 14-, and 28-day review metrics; and the human judgment required. Do not present correlation as causation. Do not recommend work already approved or in progress without acknowledging its status. Separate visibility, traffic, conversion, qualification, and reporting problems.
The dashboard should not be the first place the team sees the problem
The visible traffic decline in this case was not the first sign that performance was weakening. It was the moment the smaller page-level, technical, and operational signals became visible in aggregate.
A strong marketing intelligence network helps a team detect those smaller signals earlier, understand how they connect, and move the response through review and implementation before the lagging KPI becomes a crisis.
The advantage is not that AI always knows the answer. The advantage is that when the dashboard finally confirms the problem, the team is already working from a diagnosis, an approved backlog, and a measurement plan.
AI did not predict the future. It shortened the distance between a weak signal and action.