
Most marketing dashboards are rich in numbers and poor in operating context.
They can tell you that conversion declined, CAC increased, organic traffic fell, pipeline slowed, or returns moved in the wrong direction. They usually cannot tell you what changed around those numbers.
That missing context matters because marketing performance is shaped by more than campaigns. It is shaped by landing-page releases, form changes, pricing decisions, tracking updates, project blockers, audience shifts, product constraints, sales definitions, and decisions made in meetings.
The dashboard records the outcome. The change log explains the environment in which the outcome occurred.
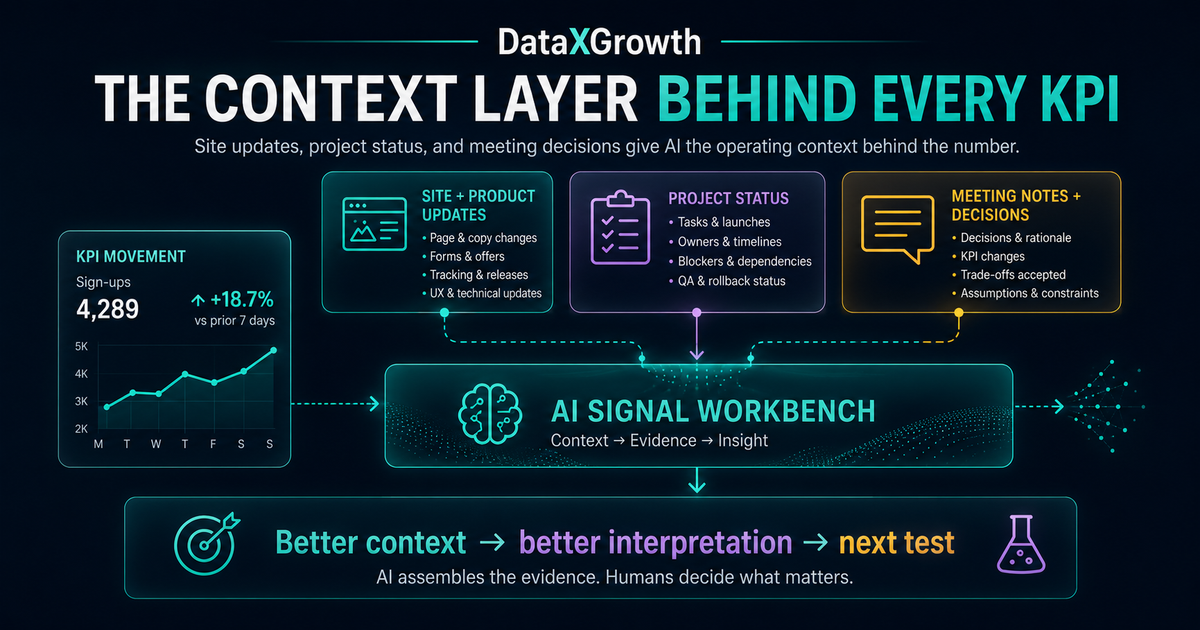
A more reliable AI marketing signal combines the KPI movement, the changes that entered the customer or operating environment, and the strategic intent, constraints, and human decisions behind those changes. That is the difference between an automated summary and a useful growth interpretation.
KPI data is an effect, not a complete explanation
Imagine that landing-page conversion falls from 4.2% to 3.1%. An AI system analyzing only the dashboard may recommend rewriting the headline, simplifying the page, testing a stronger CTA, changing the audience, or improving mobile performance. Every one of those ideas is plausible.
Now add the operating context: a new form launched five days before the decline, two qualification fields were added, mobile completion fell more than desktop, sales requested the fields because lead quality had declined, the mobile validation QA task remains open, the primary KPI is qualified pipeline rather than total form fills, and early CRM data suggests the smaller lead volume may be slightly more qualified.
The signal is no longer simply that conversion declined. It becomes: conversion declined after an intentional qualification change; the decline is concentrated on mobile; downstream quality is not yet conclusive; and a known QA issue may be contributing. Without context, AI is likely to optimize the most visible metric. With context, it can distinguish an intended trade-off from an unintended defect.
Common failure modes when AI sees only the dashboard
False attribution occurs when AI blames advertising for a conversion change caused by a form, page, price, or product update. Wrong-target optimization occurs when it recommends more leads even though the business is deliberately optimizing for qualification or retention. Stale strategy appears when the system analyzes against an old ICP. Incomplete execution causes it to judge a strategy as fully launched when critical components remain blocked. False causation appears when it turns temporal sequence into certainty. Missed trade-offs occur when lower traffic, conversion, or lead volume is treated as automatically bad despite improvements in quality, margin, or retention.
Three context streams change the meaning of a KPI
A strong AI growth signal combines three operating streams. Site and product updates describe what changed in the customer experience. Project and execution updates describe what the team actually completed, delayed, partially launched, or blocked. Meeting and decision notes describe why the team acted, what it expected, and which constraints, goals, or definitions changed.
Together, these streams create the operating timeline around the metric. The KPI says what happened. The site record says what customers experienced. The project system says what actually shipped. The meeting record says why the team made the change.
Site and product updates tell AI what changed in the customer experience
Campaign performance does not exist independently from the destination experience. An ad can remain unchanged while performance moves because the headline, proof, form, CTA, price, product availability, checkout, tracking, page speed, mobile layout, consent configuration, or third-party scripts changed.
A useful release record should capture the page, product, or journey affected; the previous and new states; the change type; the decision date; the actual launch timestamp; rollout percentage; affected ICP, device, region, or channel; expected behavior; primary KPI; guardrail KPIs; tracking and QA status; owner; and rollback state.
The actual exposure date matters more than the date the team approved the work. A decision may happen Monday, development may finish Friday, QA may finish Tuesday, and full rollout may not occur until the following Friday. KPI analysis should align to customer exposure, not the original meeting date.
Example: a product-page conversion decline
Suppose product-page conversion falls 12%. The release log shows that a financing widget was added above the primary CTA. Mobile now pushes the CTA farther down, scroll depth increased, add-to-cart declined only on mobile, average order value stayed flat, and financing use remained low.
A context-rich AI interpretation is that the widget may be creating mobile hierarchy friction rather than improving affordability confidence. The next test is a collapsed or repositioned version measured against mobile add-to-cart, total conversion, financing use, and average order value. Without the release context, the model may recommend unrelated photography or copy changes.
Project updates tell AI what actually happened
Strategy documents describe intended work. Project-management systems describe execution reality. An AI system should not assume that a campaign, landing page, tracking implementation, routing rule, or lifecycle sequence is active merely because it appears in a plan or meeting note.
Project states that materially affect analysis include planned, in progress, in review, approved, partially launched, fully launched, blocked, delayed, rolled back, and cancelled. A structured record should include the initiative, owner, status, actual ship date, due date, blocker, dependency, related campaign, page, experiment, KPI, approval state, notes, and source of truth.
Why partial completion creates false conclusions
Assume a B2B campaign was designed as a four-part system: new audience targeting, a segment-specific landing page, CRM qualification and routing, and a sales follow-up sequence. Only the audience and ads launch. If opportunity quality is weak, the accurate conclusion is not that the full strategy failed. Acquisition launched without the planned page, qualification, and follow-up components. The next action may be finishing the blocked system rather than replacing the campaign.
Use a source-of-truth hierarchy
A practical hierarchy is: the live release record for what entered the customer environment; the project-management system for status, owner, blocker, and dates; the approved meeting decision for strategic intent; Slack or chat for supporting discussion; and the original strategy document for historical assumptions. Each source has a job, and the AI should expose conflicts rather than silently choose the version that creates the cleanest story.
Meeting notes tell AI why the team made the change
Project systems capture what happened. Meeting notes often capture why. That why can redefine whether a KPI movement is good, bad, expected, or inconclusive.
High-value meeting context includes changes in business goals, KPI definitions, ICP, regions, product priorities, accepted trade-offs, legal or operational constraints, leadership hypotheses, approval status, and the review window. A transcript alone creates retrieval volume; a decision record creates usable context.
Each material decision should record what was decided, when it becomes effective, who approved it, the business reason, the KPI expected to change, the expected direction, the trade-off accepted, the project implementing it, the review date, and the open question. This keeps speculative discussion separate from approved strategy.
Meeting context can redefine whether a KPI is good or bad
Organic traffic falling 20% may be acceptable if the team intentionally removed low-value informational pages and shifted toward commercial intent. Visitor-to-lead conversion falling from 5% to 3.8% may be expected after raising the qualification threshold. CAC rising from $90 to $115 may be rational if the team moved into an enterprise segment with larger contracts and longer payback. Flat revenue may reflect inventory constraints rather than weak demand. Context does not excuse poor performance; it determines which performance question is relevant.
The shared timeline is the core data structure
The most useful structure for AI is a shared timeline that aligns performance observations with campaign launches, budget changes, creative changes, audience changes, site releases, form updates, tracking deployments, product releases, pricing changes, project blockers, meeting decisions, KPI-definition changes, inventory issues, sales-capacity changes, external events, and customer-feedback patterns.
Each event should include a timestamp, effective date, type, description, source, owner, affected audience, affected channel or journey stage, related KPI, expected impact, and current status. Decision date and exposure date must remain separate.
AI must understand lag
Tracking, forms, checkout, paid creative, pricing, and site errors may produce near-immediate effects. Email sequences, retargeting, sales follow-up, landing-page changes, and promotions have short lags. SEO, brand campaigns, category education, partnerships, enterprise pipeline, retention, and positioning require longer evaluation windows.
Every change should carry leading indicators, a short-term evaluation window, a downstream evaluation window, and guardrails. Without lag awareness, AI may reverse a long-term strategy too early or attribute the result to the wrong event.
Separate fact, context, and interpretation
A robust signal should explicitly separate the observed fact, verified contextual events, human decision context, supporting qualitative evidence, interpretation, missing information, and recommended test. For example: mobile product-page conversion declined 18%; a recommendation widget reached 100% of mobile users the previous day; the team introduced it to raise bundle attach rate; session reviews say the page feels crowded; the widget may be reducing CTA visibility; add-to-cart by interaction is unavailable; and the next test is to collapse the widget for half of mobile traffic.
This structure protects the team from AI-generated certainty. Treat every interpretation as a hypothesis until customer evidence or channel data validates it.
Worked example: a B2B SaaS demo decline
A B2B SaaS company sees demo conversion down 24%, cost per demo up 31%, sales-qualified opportunity rate unchanged, mobile form completion down 38%, and desktop form completion down 8%.
The site context shows that a six-field form replaced a three-field form, mobile QA is incomplete, a chatbot launched the same day, and targeting did not change. Project context shows CRM routing is complete, mobile QA is blocked, chatbot analytics are missing, and the follow-up sequence is still in review. Meeting context shows that sales requested more qualification, leadership accepted lower lead volume if sales acceptance improved, the primary KPI was cost per accepted opportunity, and quality was scheduled for a four-week review.
The weak AI recommendation is to shorten the form immediately. The context-rich interpretation is that conversion declined after the qualification release with disproportionate mobile impact; some loss was intentional, but sales quality has not yet improved; incomplete mobile QA may be creating unintended friction; and the team still lacks cohort acceptance, validation-error, chatbot-overlap, and four-week pipeline data. The next step is to fix mobile QA, continue long enough to measure accepted opportunities, and avoid reverting the entire strategy before separating intended qualification loss from technical friction.
How DataXGrowth AI is being built around context-rich signals
We are not building DataXGrowth AI as another dashboard that restates channel performance. We are building it as a context and interpretation layer for brand teams.
The system is intended to connect marketing and revenue performance with site and product releases, project status and blockers, meeting decisions, KPI definitions, ICP context, brand constraints, customer and sales feedback, previous experiments, and human approvals or rejections.
The goal is to help the team answer what materially changed, what entered the customer environment, what fully shipped, what remained blocked, why the change was made, which trade-off was accepted, what evidence supports the explanation, what contradicts it, what remains unknown, and what deserves a focused test next.
Human-defined context → AI-assisted interpretation → human-owned decision → documented next test
AI helps retrieve, align, summarize, and remember evidence. The strategist still owns customer interpretation, brand judgment, causal conclusions, risk, budget, and action. The momentum comes from not starting from zero every week. A brand team can carry forward what it believed, what it launched, what customers said, what the metrics did, what the team accepted or rejected, and what the last test taught everyone.
Retrieval rules matter as much as integrations
Connecting project management, meetings, CMS, analytics, advertising, and CRM is not enough. Retrieval should be time-bound around the KPI movement, journey-bound to the affected page or funnel stage, segment-bound to the affected ICP or cohort, authority-bound toward live releases and approved decisions, and freshness-bound away from expired plans.
The system should also detect conflicts. If chat says launched, the project system says blocked, the release log has no deployment, and the dashboard assumes active, AI should surface the disagreement rather than silently selecting one version.
Human review is required at three points
First, context approval verifies that release, project, and decision history is accurate. Second, interpretation approval checks that the proposed explanation matches business and customer reality. Third, action approval determines whether the recommended experiment is commercially, technically, legally, and ethically appropriate. Human judgment is not a fallback for weak AI; it is part of the system architecture.
A weekly AI-assisted review using all three streams
A practical weekly review should cover the material KPI signal, the site and product changes that entered the customer experience, the project work that shipped or remained blocked, meeting decisions that changed goals or trade-offs, customer evidence from sales and support, the AI interpretation, the human decision, and the memory update. The meeting should end with a decision, owner, evaluation window, and next review date.
Reusable AI prompt
Act as a growth-signal analyst. Interpret a KPI movement using the KPI definition, business objective, affected ICP, dated site and product changes, project status and blockers, meeting decisions and trade-offs, customer or sales feedback, tracking caveats, and previous experiments. Return observed facts, verified contextual events, strategic intent, plausible explanations, supporting and contradicting evidence, source conflicts, missing information, expected lag, recommended next test, primary and guardrail KPIs, kill/iterate/scale/investigate conditions, and the human decision required. Do not state correlation as causation. Do not assume a project launched without a verified release date. Do not optimize a KPI without considering the business objective and guardrails.
How to measure whether the context layer works
Measure change-log coverage, task-to-release accuracy, decision linkage, context freshness, source-conflict rate, false-cause rate, human correction rate, time to diagnosis, experiment quality, and learning retention. The objective is not only faster reporting. It is a higher percentage of AI recommendations that are evidence-linked, correctly scoped, reviewed by a human, and converted into focused tests.
A 30-day implementation plan
During Days 1–7, define standard records for site changes, project updates, meeting decisions, KPI observations, customer evidence, AI interpretations, and human decisions. During Days 8–14, establish which platform is authoritative, who maintains it, refresh cadence, approval rules, and conflict resolution. During Days 15–21, build the shared timeline and test it retrospectively against known performance movements. During Days 22–30, pilot human-reviewed signals and measure accuracy, edit rate, time saved, and experiment quality.
The dashboard is only the beginning
A dashboard can tell the team that something changed. It cannot independently explain what the team shipped, what customers experienced, why the change was made, what remained blocked, which trade-off leadership accepted, or what the company was actually trying to improve.
That context lives in site releases, project-management systems, meeting decisions, and customer feedback. AI becomes more useful when those records are connected to the KPI timeline. It can help retrieve evidence, identify plausible explanations, detect conflicts, respect business intent, design focused experiments, and preserve what the organization learns.
The output is not autonomous marketing. It is a more accurate feedback loop between execution, measurement, customer reality, and human judgment.